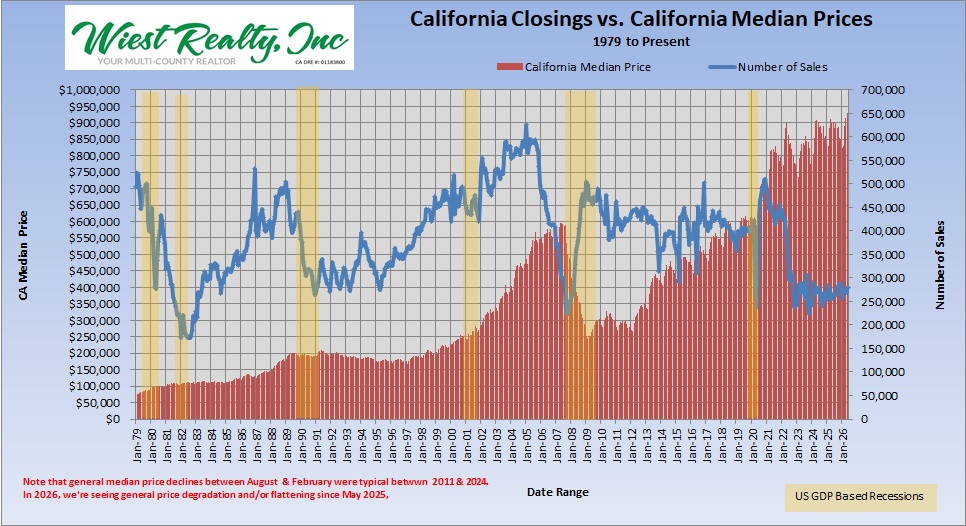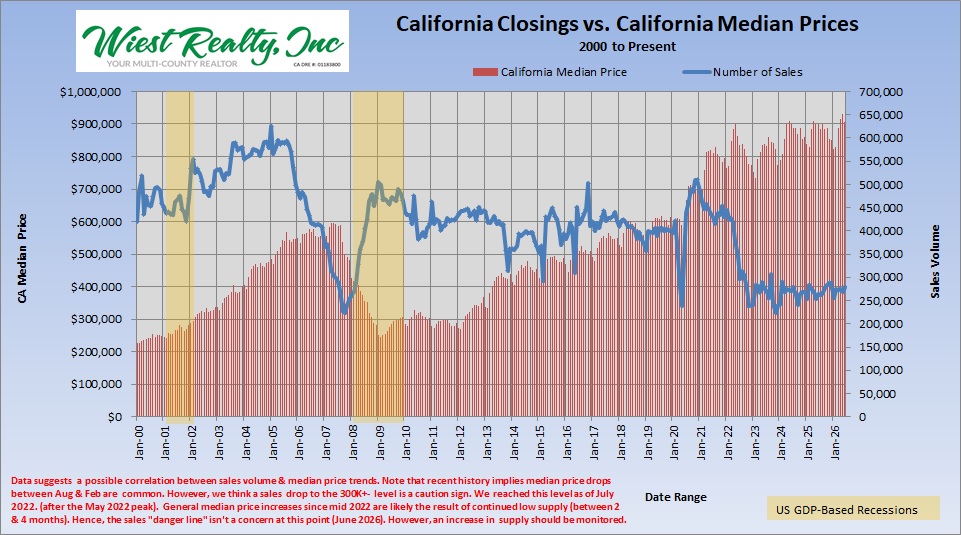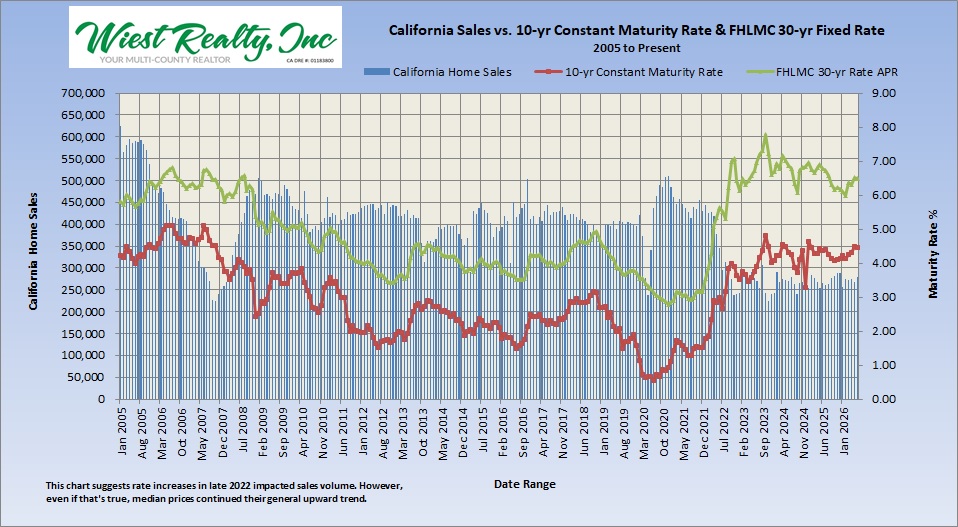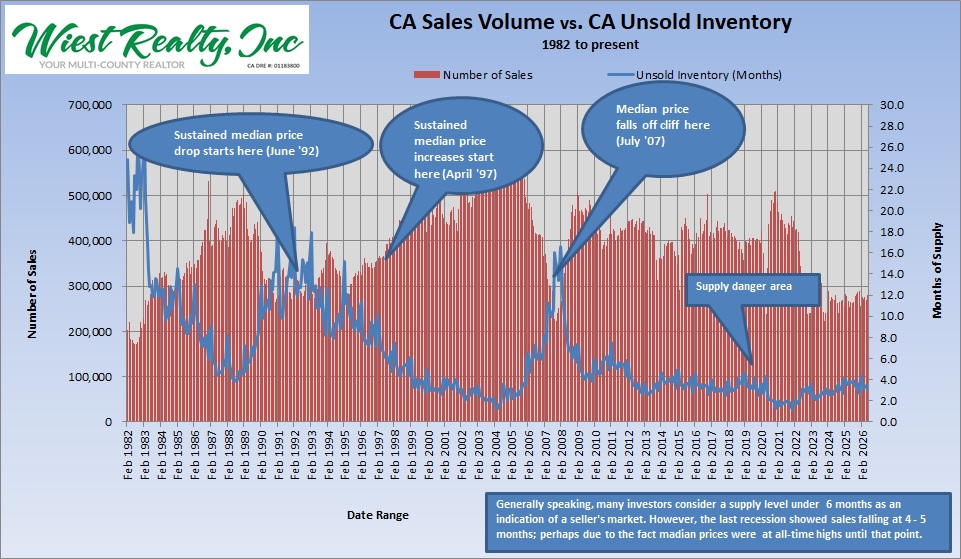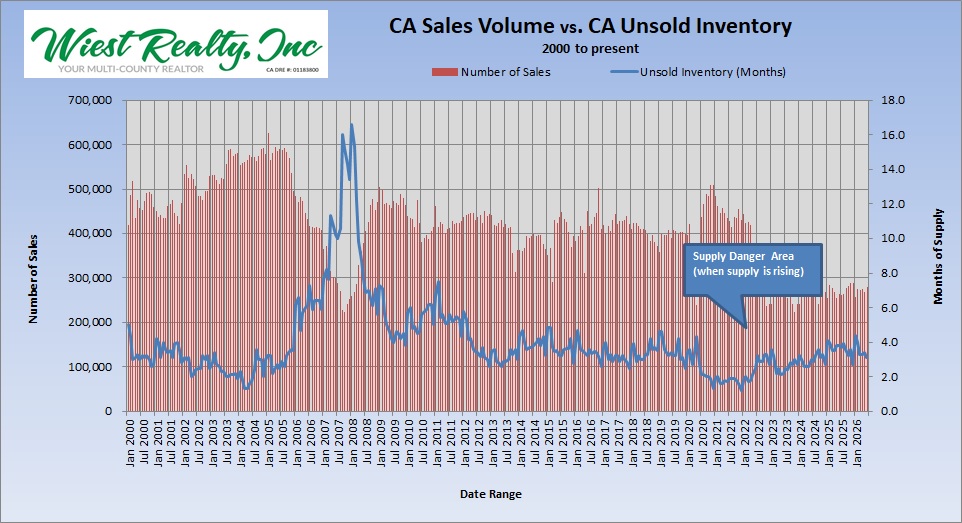
June 2026 year over year sales increased 0.4% but were up 5.6% from the prior month. Between January 2026 and June 2026, year-over-year sales numbers were positive for five of the last six months. However, most increases were below 1%.
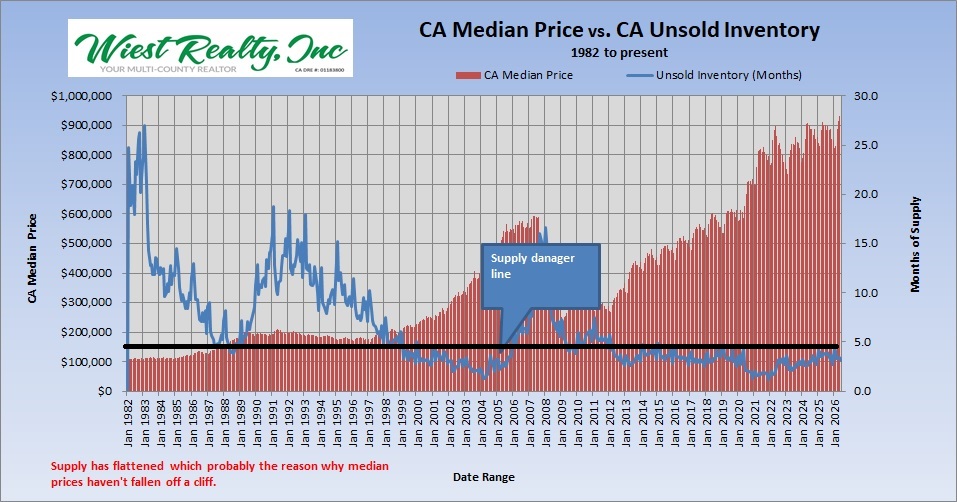
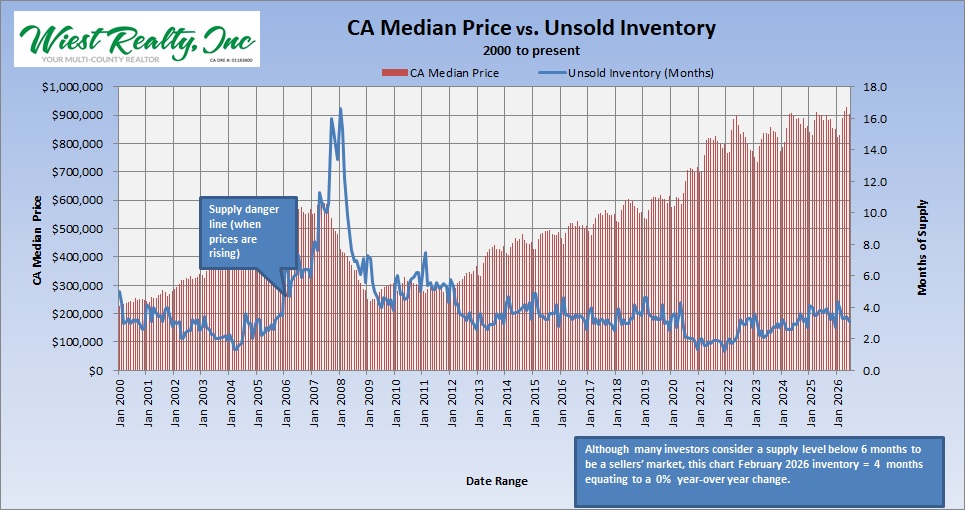
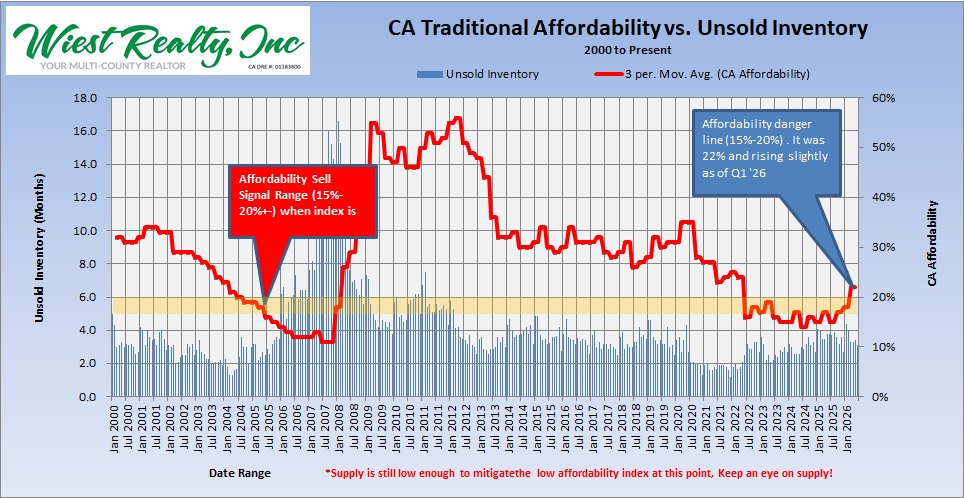
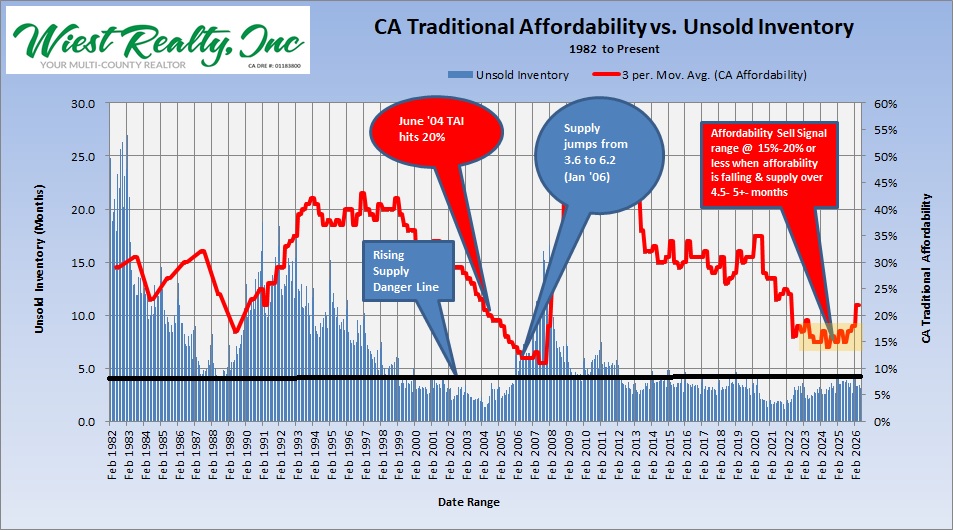
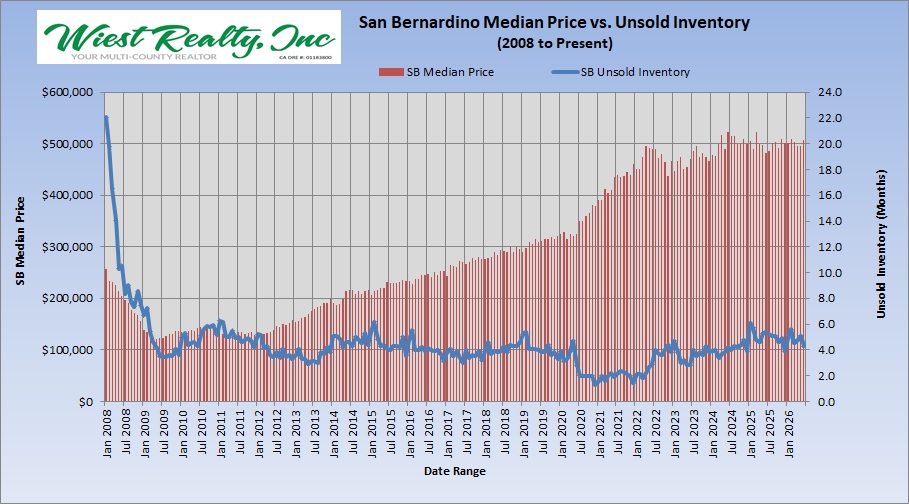
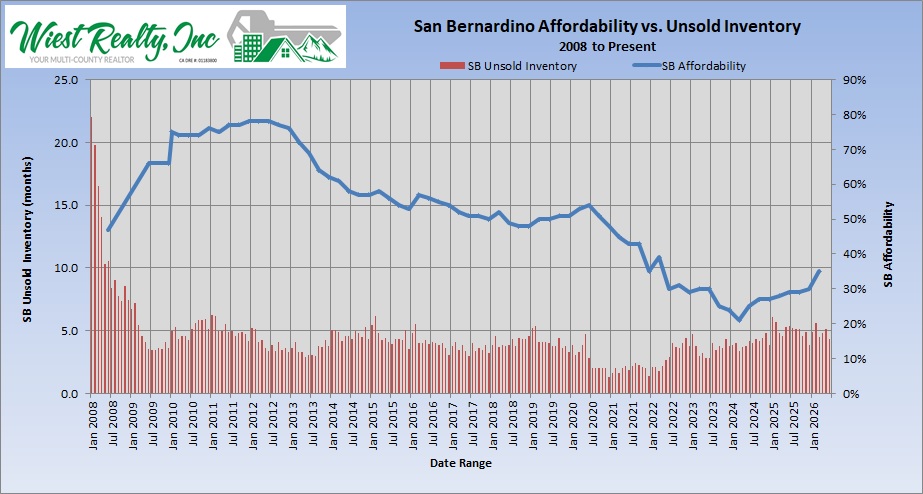
California single family home supply (unsold inventory) for June 2026 was reported at 3.1 months resulting in a -18.4% year over year change, That’s good for sellers. Since January 2026, supply has been steadily decreasing from 4.4 months. In fact, supply hasn’t been near the 4,4 month level since May 2020 when it hit 4.3 months. So far, however, supply is below what we call the “danger line” but keep an eye out for more median price softness if supply starts pushing the 4.5 to 5 month area.
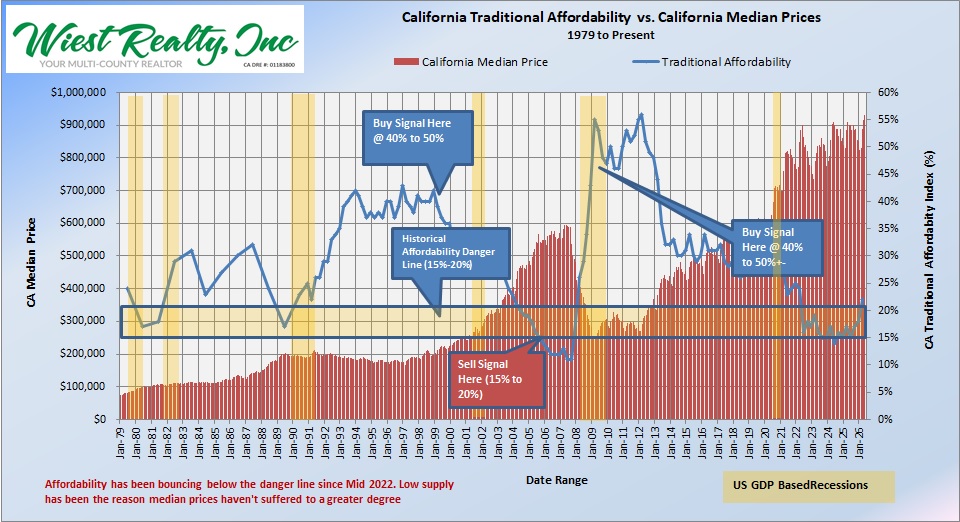
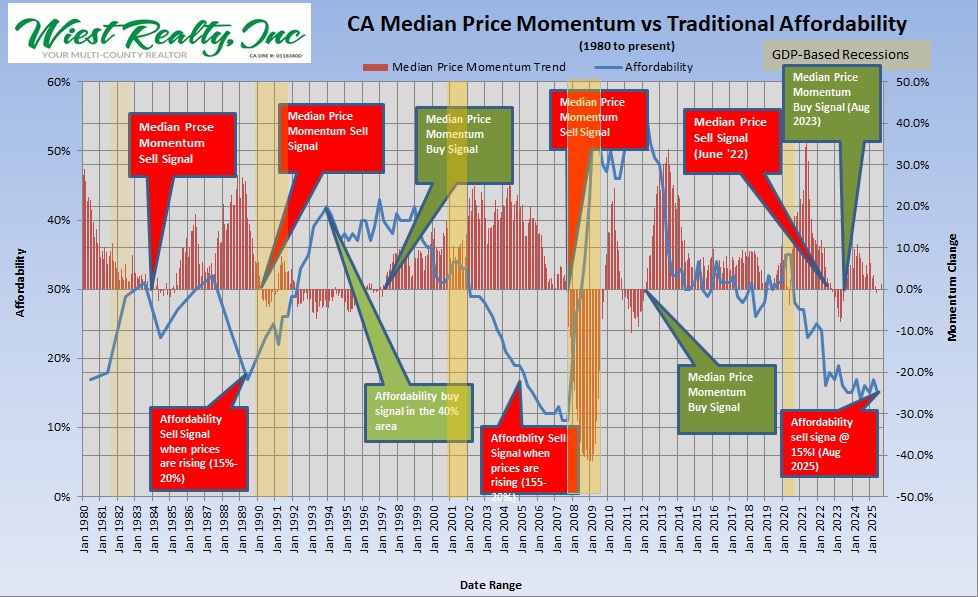
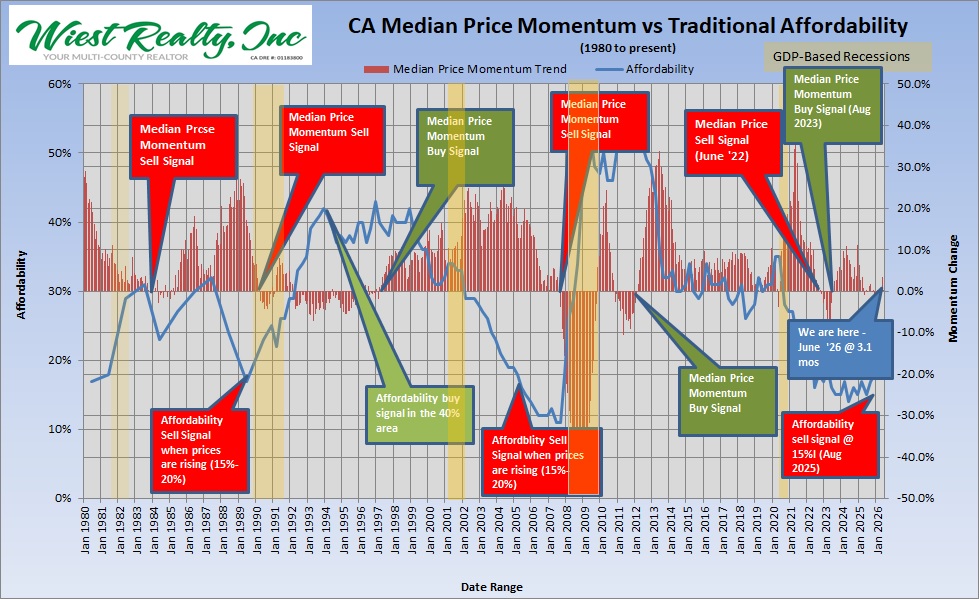
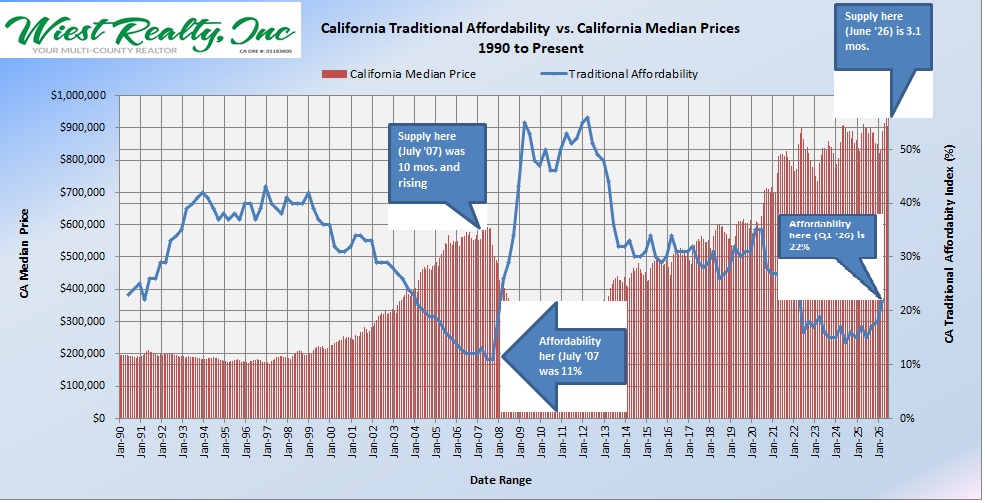
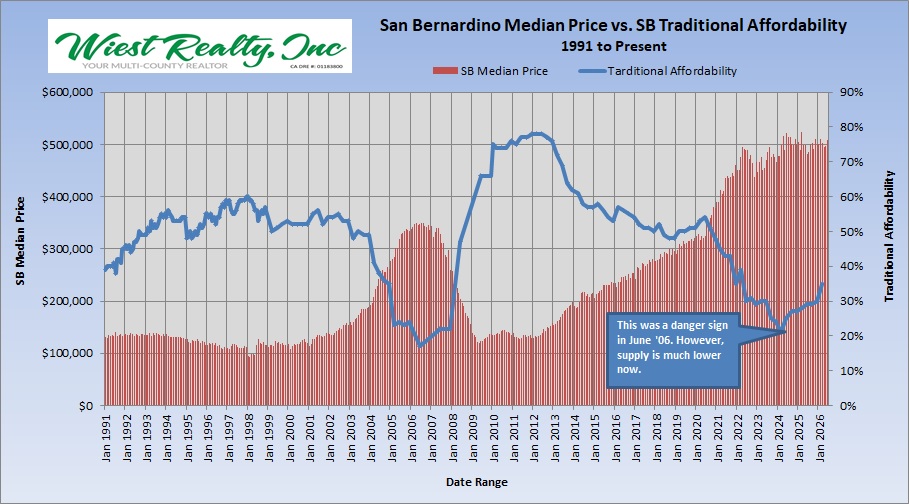
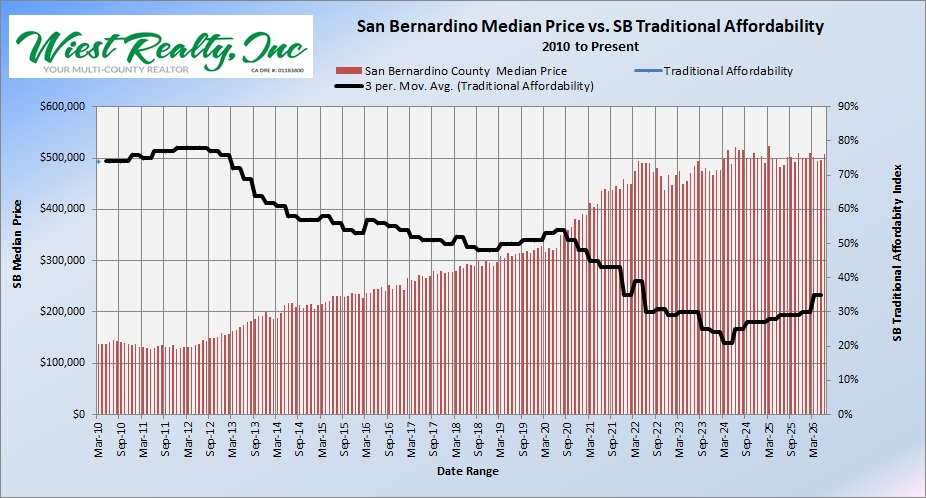
With the California Q1 ’26 traditional affordability index at 22%, one would expect some year-over year price damage– and that’s what we saw throughout most of the last half of 2025. However, it’s important to note California traditional affordability rose from the Q4 ’25 level of 18%. Year-over-year median price momentum crossed into negative territory in May 2025 and has been bouncing between -1.9% and +3.3% this year. Historically (since 2011), median California prices tend to generally drop between August and February. Month-over-month figures show this was pretty much true between August 2025 and February 2026.
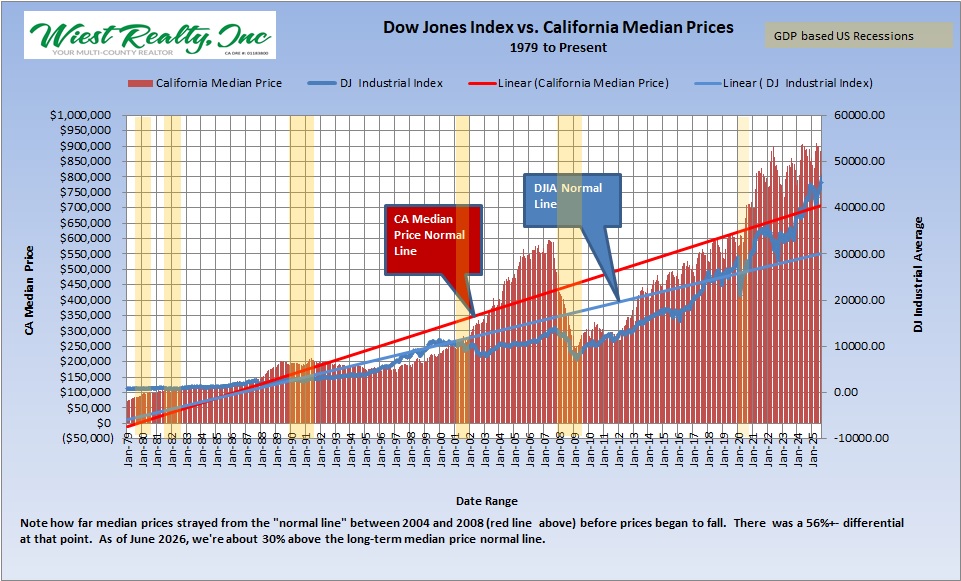
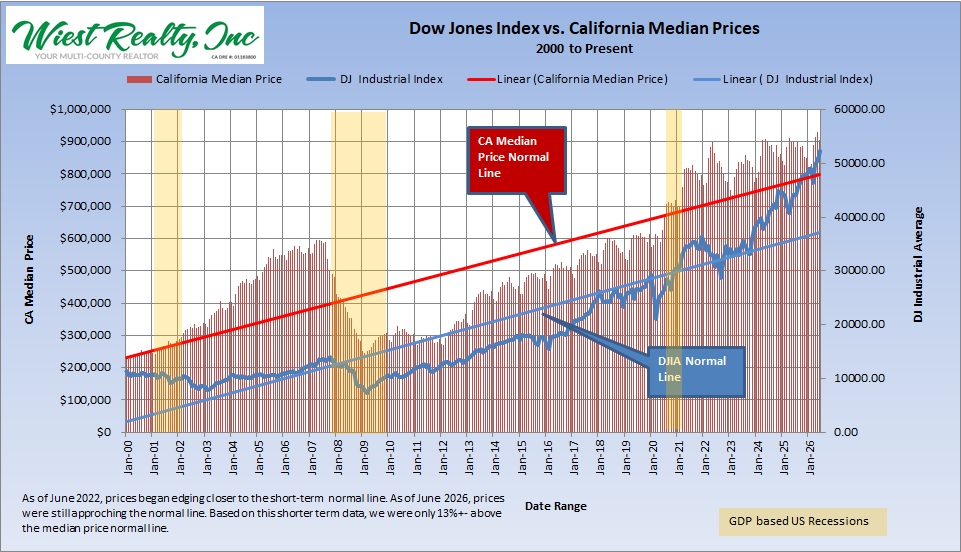
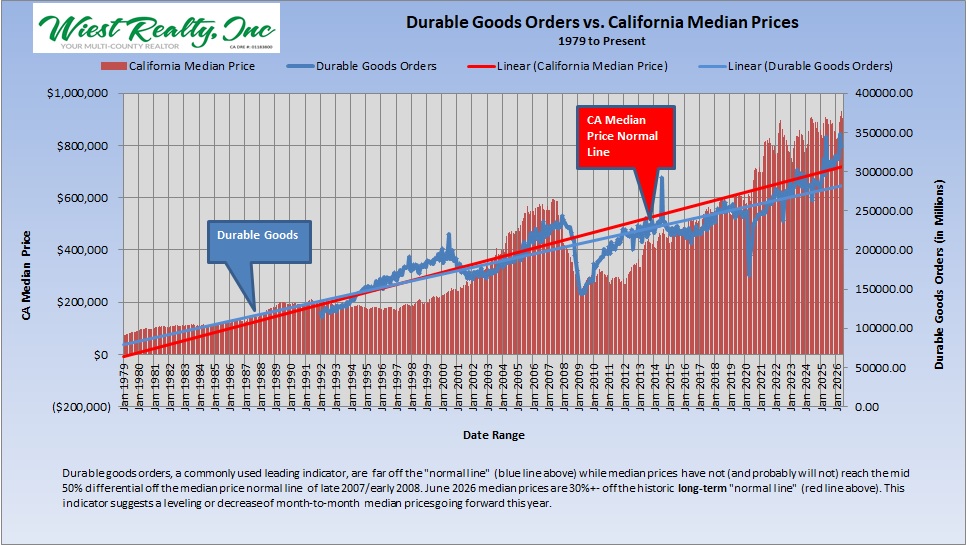
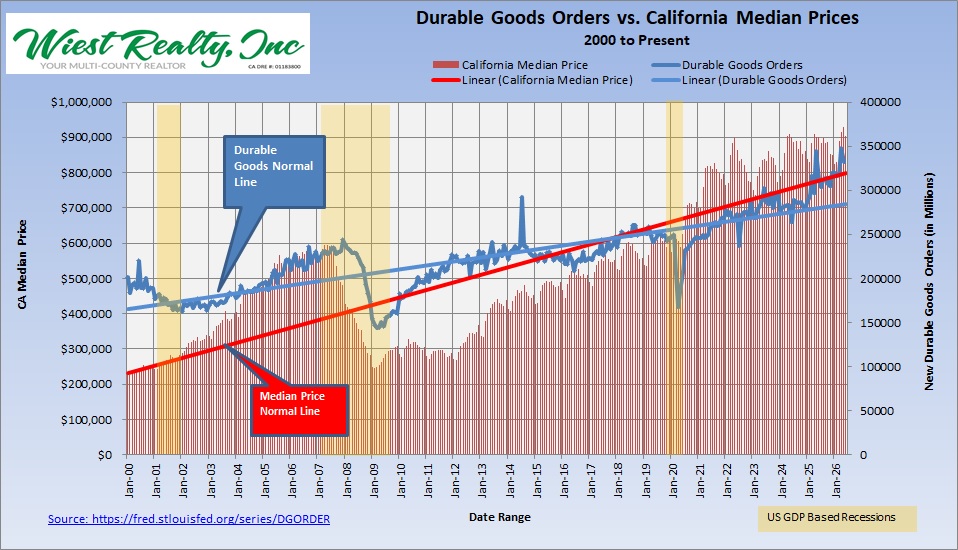
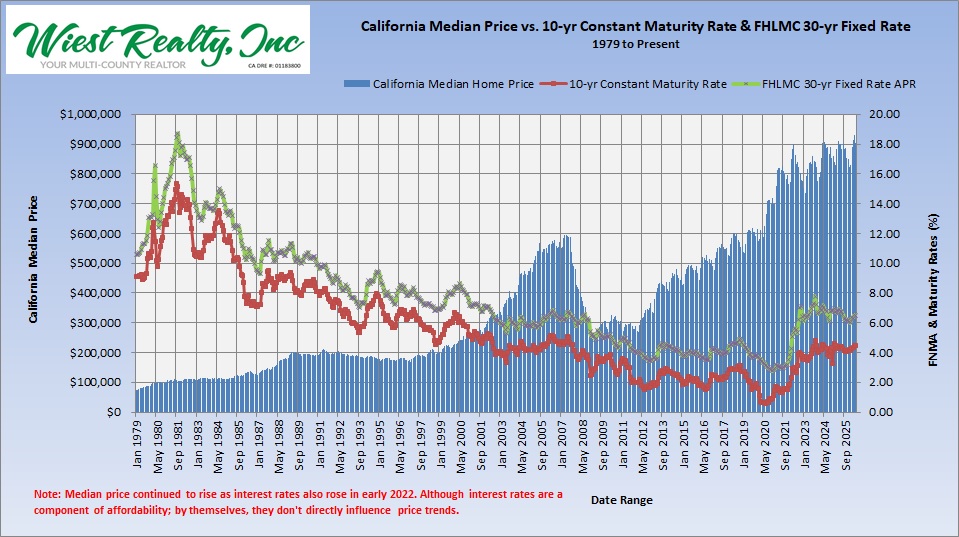
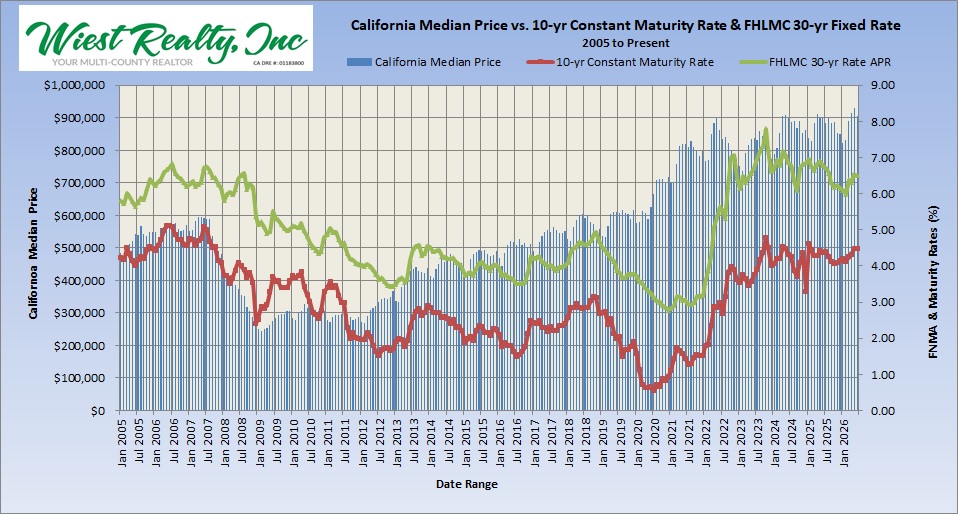
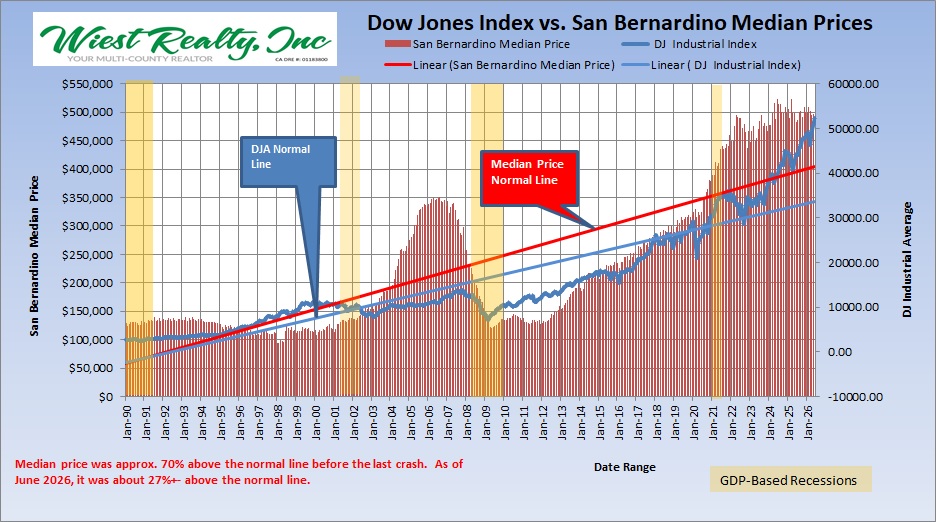
Median California single family home prices for 2026 ticked downward between May and June by about -2.8%. Note, however, median price is getting closer to the “normal line” (a linear track that centers the distribution of median prices). The long-term normal line shows a deviation of about 30% as of June 2026 with the short-term line showing only about 13%. The long term normal line high was 56% in early 2007. These numbers along with median price momentum bouncing between small positive and negative territory implies some continued price damage is likely on the state level overall. All else being equal, we don’t expect substantial price damage as long as supply stays low (below 4.5 months).
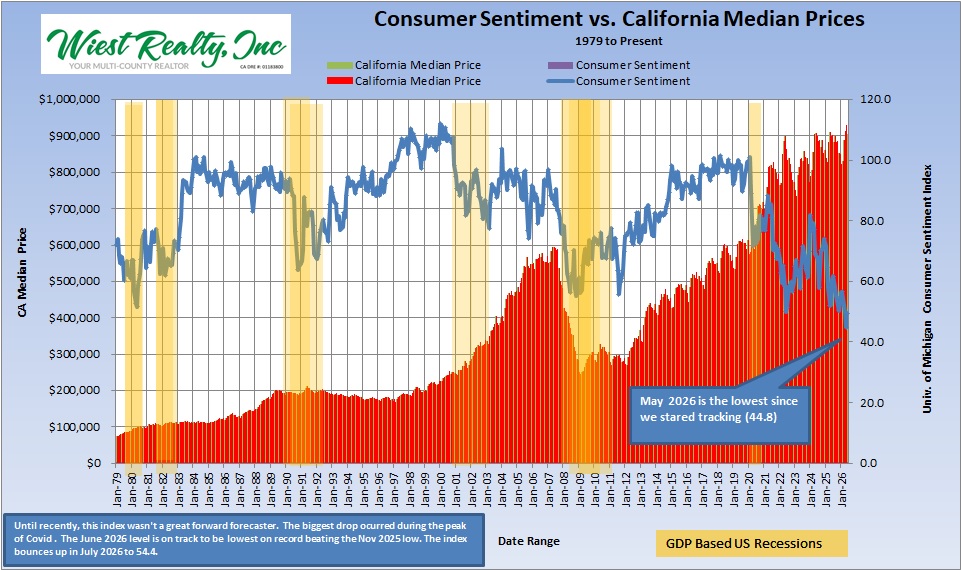
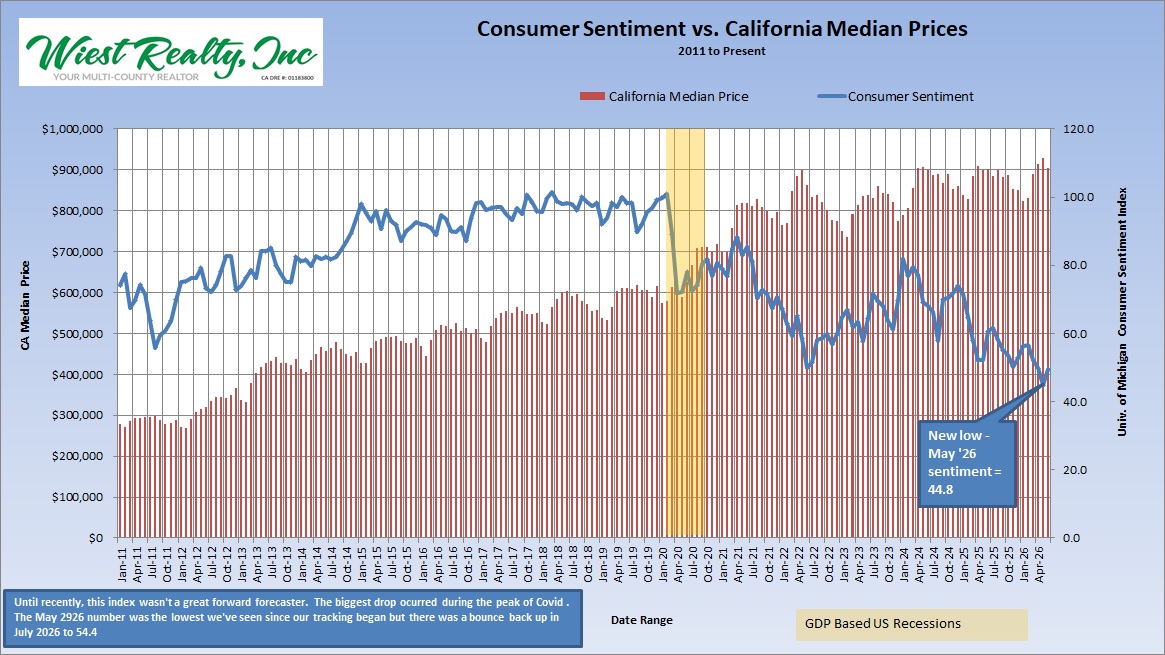
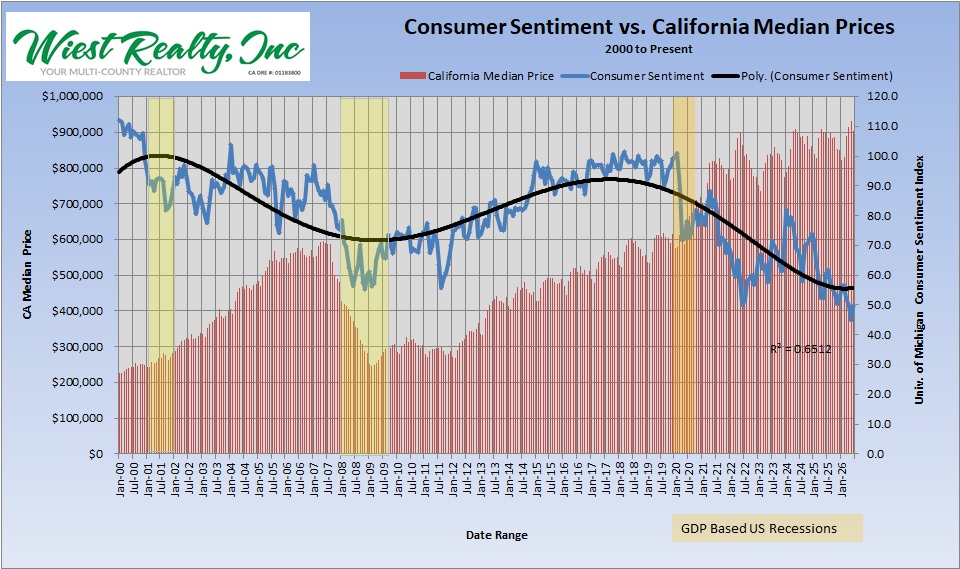
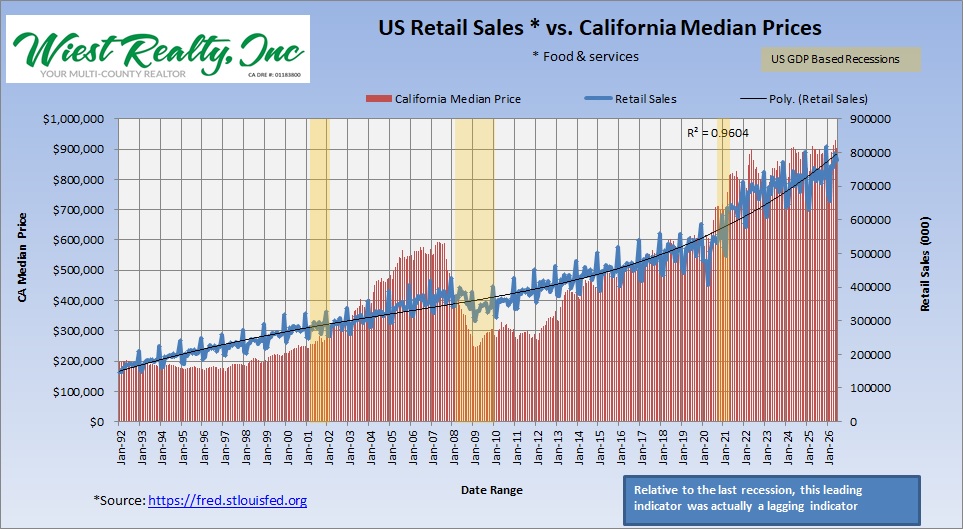
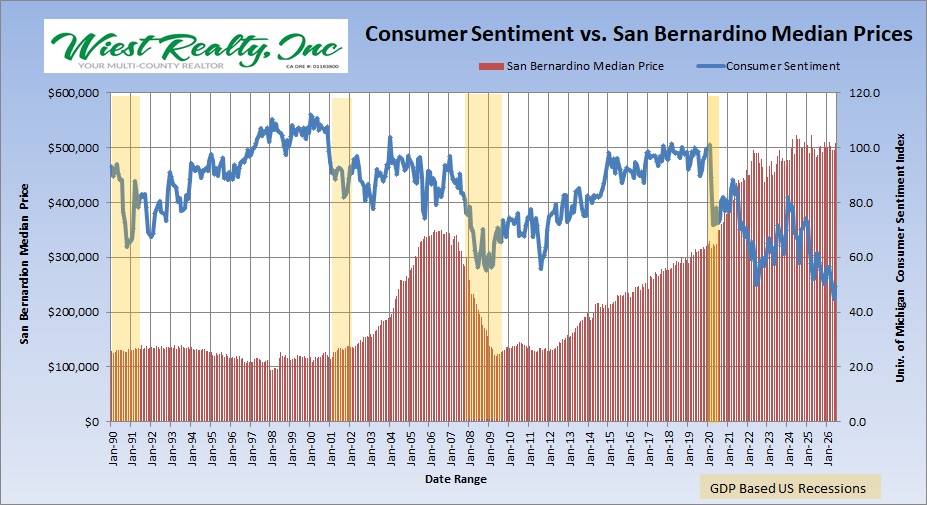
Consumer Sentiment continues its general decline; although it bounced up a little bit from the May 2026 historic low. While this index is considered a leading indicator, it doesn’t lead by much. However, it suggests more down-side risk should be considered in your investment models.
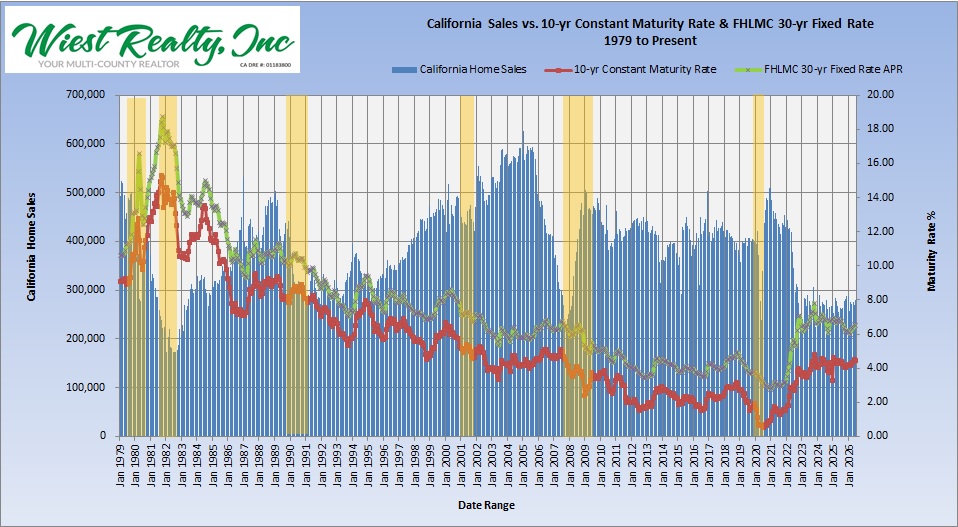
People are still not willing to give up those 4% or less mortgages to move up to a larger home. About 50% of US mortgages carry a note rate of 4% or less. Per MarketWatch, California data estimates are 55% to 60% of mortgages are under 4%. This is probably one factor mitigating supply increases. Hence, supply remains relatively low. In fact, California supply has been generally around or under 4 months for 10+- years. However, keep an eye on supply as a major increase will likely impact median prices. Of course there are many external factors that can influence trends. So assuming no wars, gas shortages, political upheaval, major population exodus, or similar incidents , it’s our opinion that if supply starts pushing the 4.5 to 5-month level and traditional affordability stays in (or falls below) the 22% area, we will see increased median price degradation. Check out the charts and tell us what you think.
The following data applies to California as a whole and applies only to single family dwellings. Every local market is different. If you need help with your local market, simply call us or fill out the contact page.
Check out our momentum indicators page for the latest trends.
Check out the graphs – let us know your opinion.